
Money
Depends on prize places, the rules and verification of the entry.
FROM COMIC TO ENGINEERING
From the brief to a solution: data, models, parameters and decisions worth testing. A guide to reading the comic with more context or starting your own investigation.
An organiser sets a problem, a scoring method and material to work with. Teams build solutions and submit an entry. Some challenges accept predictions; others run submitted code in a controlled environment. Before choosing a network, we need to understand exactly what is required.
Think of an exam for which we can study worked examples. We need to set some aside to test our ideas without using their answers during training. The leaderboard adds an external comparison. Many competitions have a public score and a separate final score: chasing every public improvement can lead us towards a solution that performs worse on the latter.
I would start with a learning competition, reproduce a simple solution and change one decision. That first submission teaches the whole route: read data, learn, predict and produce the right file. Complexity can wait until we know what fails.
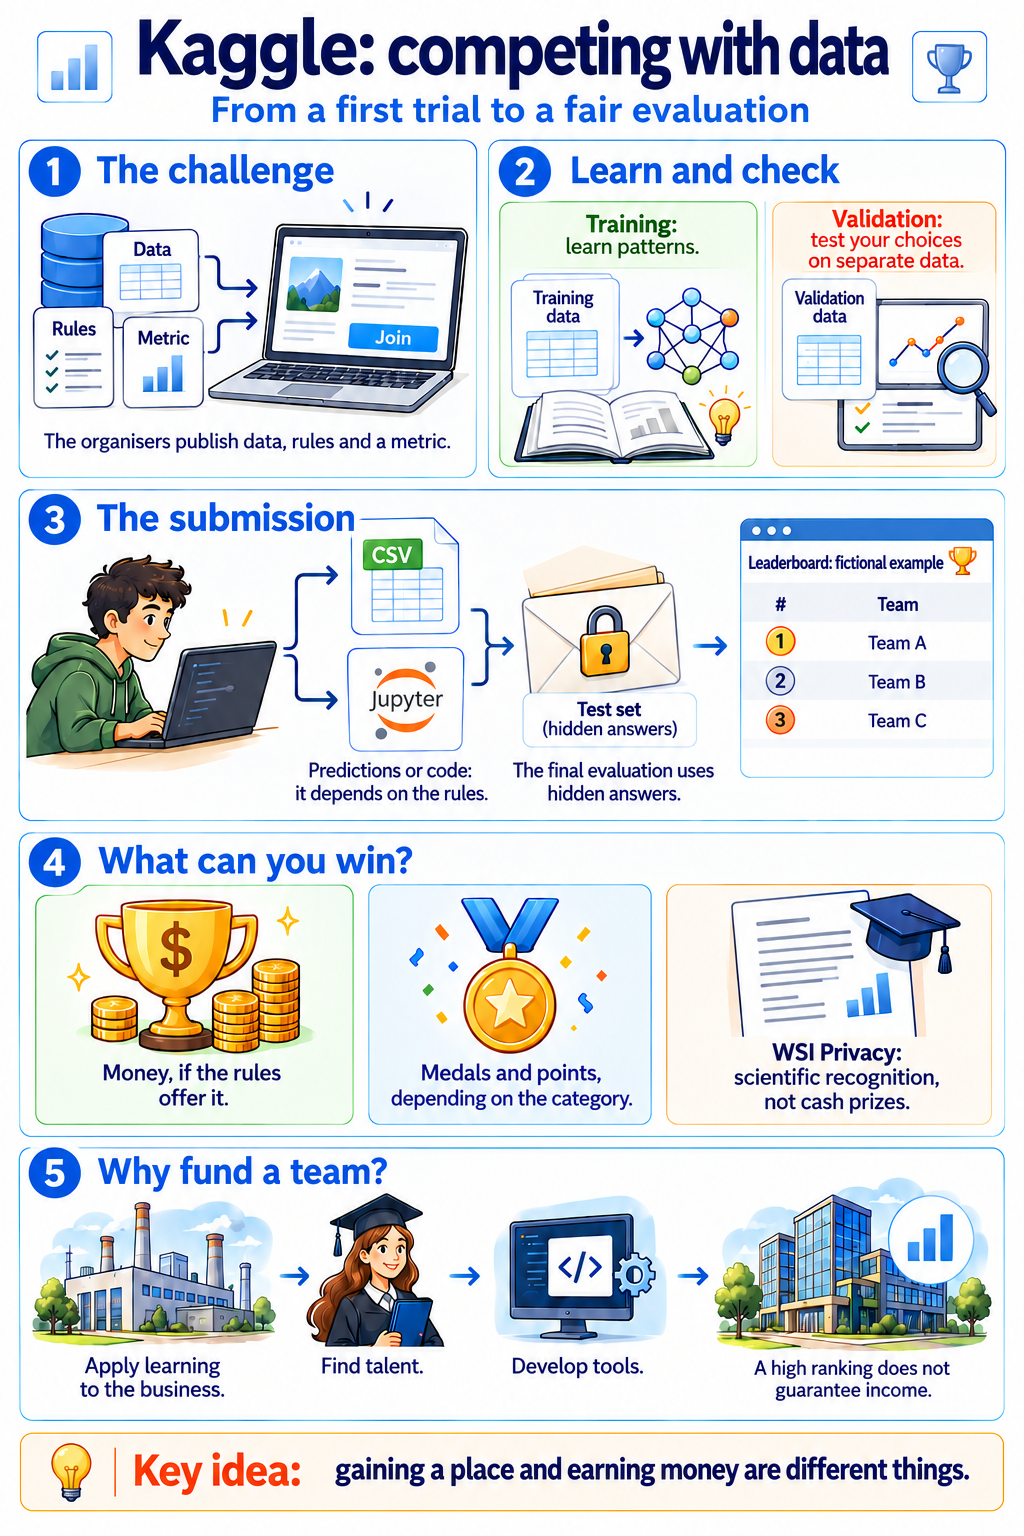
The leaderboard is a fictional example. Prizes depend on each competition’s rules.
Enlarge and read the infographic ↗The organisers publish data, rules and a metric. The team trains on one set of data and tests its choices on separate validation data.
The rules determine whether predictions or code are submitted. The final evaluation uses hidden answers. The illustrated leaderboard is fictional.
Cash prizes exist when the rules offer them; medals and points depend on the category. WSI Privacy offers scientific recognition, not cash prizes. A company may fund applicable learning, tools and talent: a high ranking does not guarantee income.
Goal, rules and submission
A result we can reproduce
Using held-out examples
In the required format
Read the rules. If money is allocated to three places, the runner-up can receive a prize too. If only first place is rewarded, coming second does not create a cash entitlement. A strong finish does not turn participation into a salary.
Three things often get mixed together when people discuss Kaggle: money, recognition within the platform and scientific recognition. The organiser specifies the offer and its conditions. Medals are not money, and not every competition awards them.
WSI Privacy announces scientific recognition: an invitation to a joint publication for leading teams and certificates. It does not announce a cash prize. ATLAS’s funding belongs to the fiction.
Depends on prize places, the rules and verification of the entry.
Recognise results in eligible competitions. They are not payment.
A publication, useful method or collaboration may be the goal.
Benchmarking WSI Privacy, Track 1 asks participants to select, from 100 candidates, images from the same patient as a query, using visual content. There may be none, one or several. Entries are CSV files, scored with mean per-query F1.
Imagine two collections with names removed. If an image links them, it could bring together information believed to be separate. This exercise investigates that connection. It is not a diagnosis task or an attempt to obtain someone’s name.
The diagram below illustrates the question. A similar-looking image can be a false match; we need to learn which similarities are useful. Track 2 asks a different question: linking a synthetic image to the real one it came from.

The tissue samples are invented illustrations, not images from real patients.
Enlarge and read the infographic ↗Tissue is digitised into a large microscopic slide image. Tiles are selected to process it.
Given a query image, find gallery images from the same patient. There may be no matches, one or several. A and D represent the matches in the illustrated example.
Finding the same slide is different from recognising another tissue section or another block from the patient. Visual similarity alone does not prove identity.
Select tiles, extract features, compare and return matches. Training and validation patients must be separate. F1 accounts for correct, false and missed matches. Removing the name does not remove all identifying information.
The page announces 10,000 training tasks and 5,000 test tasks, with DORS/VEN blocks and patients separated between the two sets. Patient codes let us construct and mark examples; they are not inputs for guessing the answer.
A task contains a query and its gallery. It may reuse images found in another task. So 10,000 tasks do not mean 10,000 people. We can extract many tiles within an image; they add computation without creating new patients.
A WSI is a scan of a tissue slide. We read regions at different resolution levels to process it. OpenSlide exposes dimensions and, where available, micrometres per pixel: the physical size represented by each pixel. A 224 × 224-pixel tile can show different amounts of tissue depending on scale.
For an invented example, a 60,000 × 100,000-pixel image needs 18 GB when fully loaded as uncompressed 8-bit RGB: six billion pixels times three bytes. The compressed file may be much smaller. Reading regions avoids loading the whole image at once.
May contribute several samples
Physical material behind the image
Digital scan file
Regions supplied to the network
Recognising an exact copy, two scans of a slide and different tissue samples from one person calls for different signals. We can get the easy cases right while failing precisely where research matters. Analysing these cases separately prevents a good average from hiding the problem.
The earlier study by Holub and colleagues compares ResNet, VGG16, Inception, Img2vec, SimCLRv2 and VGG16histo. It examines scanners, distance between sections and cropping. Removing the boundary does not necessarily prevent linkage. Its risk measure Rs and protocol differ from the competition’s F1.
The study has public code, and the article reports experimental CSV data and an R notebook. These provide a starting point for studying methods and results; they are not a winning solution to this competition. We have neither run that code nor retrieved the results package to recalculate its plots.
Simple comparisons may detect a copy.
Colour, scale or scanning appearance may change.
Some structure may persist between sections.
Looking for a shifted copy of the same pattern is insufficient.
I would first inspect a small inventory and open real images. Next, I would reserve patients for validation. Then I would build a simple baseline: a pretrained ResNet50 with frozen weights and cosine similarity. Frozen means the weights are not updated during this experiment.
The network turns each image into a vector, a list of numbers summarising visual features. Cosine similarity compares these vectors. This first version can produce answers and expose preparation mistakes, even if it is not yet competitive. It is a vision model. The agents helping to program at ATLAS use language models, or LLMs; in the story both rely on deep learning, but they have different functions.
Each task contains one hundred candidates. I would start by comparing all of them. Approximate search adds complexity and can miss matches; I would introduce it if measured cost shows a need. I would save the vectors so that testing another decision rule does not require extracting them again.
A CNN applies learned filters to image regions. A Vision Transformer, or ViT, relates patches through attention. Architecture matters, but so do the learned weights and input preparation. I would compare specific versions using the same patient split.
UNI and Prov-GigaPath offer representations pretrained on pathology. I would consider them against a general-purpose model, checking access, weight-use conditions and competition rules. Learning diagnostic patterns does not guarantee retaining the best signal for linking samples.
With several tiles per image, we also need to decide how to combine them. Averaging is simple but can dilute an important detail. Attention-based aggregation learns different weights for regions, yet requires data and can learn shortcuts. The comparison must establish what it adds.
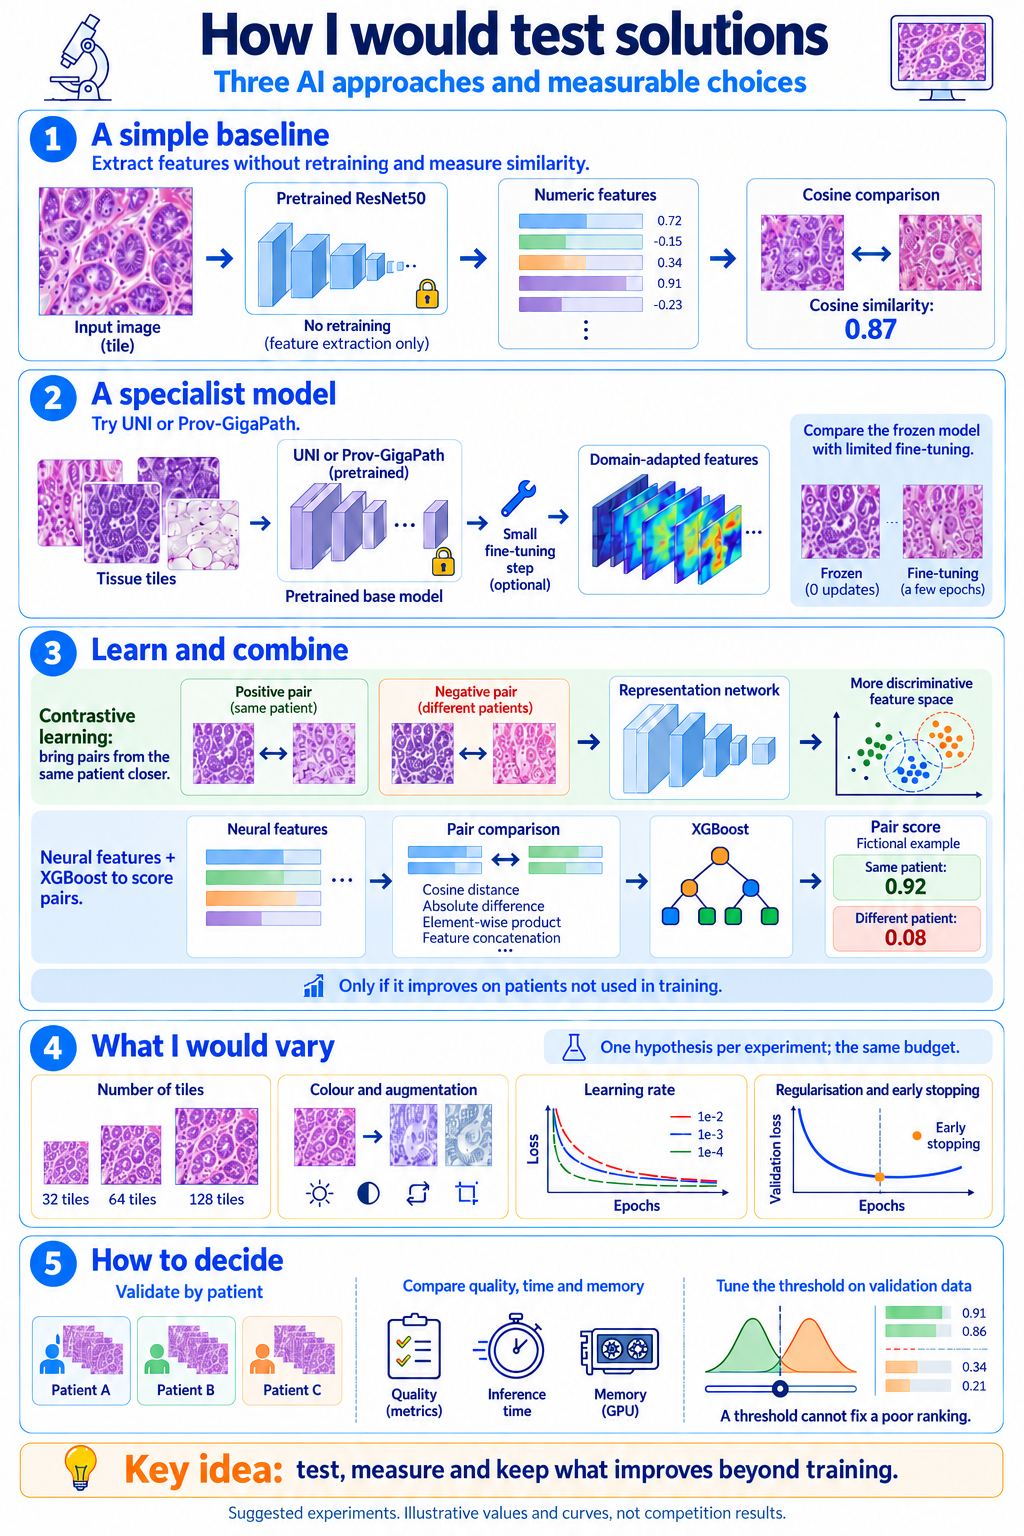
Suggested experiments. The values, curves and tissue images are illustrative examples, not competition results.
Enlarge and read the infographic ↗Start by extracting features with a pretrained ResNet50 without retraining and compare cosine similarity. Then try UNI or Prov-GigaPath, frozen and with limited fine-tuning.
Contrastive learning uses pairs from the same patient and from different patients. Another approach uses neural features and pair comparison features —cosine distance, absolute difference or element-wise product— for XGBoost to score pairs. The displayed scores are fictional.
32, 64 or 128 are tile counts, not dimensions. Compare colour changes and augmentation, learning rate, regularisation and early stopping with one hypothesis and a common budget. The illustrative curves do not establish which learning rate is best.
Validate by patient; measure quality, time and memory; tune the threshold on validation data. A threshold cannot fix a poor ranking. Keep only what improves on patients not used for training.
ROUTE 1
Lower-cost experiment: network weights stay fixed.
ROUTE 2
Updates some weights to learn the similarity we need.
ROUTE 3
The network describes; another model learns to combine the signals.
Learning similarity needs related examples and confusing but unrelated ones. Contrastive loss penalises inappropriate distances; triplet loss compares an anchor, a positive and a negative. I would not train only to recognise a closed list of patients: the test contains new people.
I would not force any two tiles from one person to look alike either. They may show different structures. If labels only establish a relationship between whole slides, supervision should reflect that level, or the choice of region pairs needs justification.
This table is a reasoned starting point, not an optimal recipe. I would try a few alternatives with a shared budget, retain the best validation checkpoint and extend the search when the errors justify it.
| Decision | Suggested first alternatives | What I would observe |
|---|---|---|
| Tiles and scale | 32, 64 or 128 regions; matched physical scale for comparisons. | Whether more detail improves difficult cases or only increases runtime. |
| Transformation | Rotations and flips; moderate staining variation, with/without normalisation. | Whether the useful origin signal survives or is removed. |
| Trainable layers | A small head only; then the final blocks. | Whether adapting more parameters helps or memorises the data. |
| Learning rate | Illustrative trials: 0.00001 / 0.00003 for blocks; 0.0001 / 0.0003 for the head. | Whether adaptation is stable. Ranges depend on the model and batch. |
| Batch and negatives | Several patients and examples per patient; correctly labelled hard negatives. | Whether the model learns real confusions, rather than easy pairs alone. |
| Regularisation and stopping | Weight penalties; patience such as 3 or 5 evaluations. | Validation against training; restore the best checkpoint, not simply the last. |
Yes, it is worth testing. The network extracts representations, and we construct one row per pair: global similarity, vector distances, statistics of local matches and image-quality signals. Logistic regression provides a simple baseline; XGBoost can learn nonlinear combinations.
For example, high global similarity might be insufficient when the most informative regions disagree. A combiner can learn to use both signals. I would vary tree depth, learning rate and regularisation. I would not feed it billions of pixels or the patient code that contains the answer.
We can also combine scores from two networks. I would inspect their errors first: if both fail on the same queries, we may pay twice for almost the same result. Training a combiner requires predictions for patients unseen during base-model fitting, with compatible score scales.
The threshold determines the minimum score for accepting a match. Lowering it may recover a true match and admit a false one. Raising it can clean up the answer while excluding something we should find. It does not update the network’s weights.
This invented example has six candidates so you can follow the calculation. A and C are the true matches. Scores are illustrative similarities, not probabilities. Move the control to see what enters the answer. You can also try a query with no matches.
With these scores, B is false but scores higher than C, which is true. No threshold can accept C while rejecting B. Fixing that error requires better signals or a model that combines them differently.
Precision measures how much of what we propose is correct. Recall measures how much of what we should find we recovered. F1 combines both: 2 × true matches / (2 × true matches + false matches + missed matches). In this exercise, correctly returning an empty set scores 1; adding a false match to it scores 0.
INTERACTIVE EXAMPLE · INVENTED DATA
Candidates enter the answer when their score is at least the threshold. Without JavaScript, the initial example is shown: threshold 0.65 and answer A, B, C.
Answer: A, B, C
2 true matches · 1 false match · 0 missed matches
We found A and C, but also included B.
A smaller gallery to explain the calculation. These figures are not competition results. Precision or recall with a zero denominator are shown as undefined; F1 uses the empty-case convention explained above.
I would split patients before extracting tiles or forming pairs. If fragments from one person appear on both sides, the program can recognise familiar material and give us an inflated impression of its ability. Transformations that learn statistics must also be fitted only on the training group.
I would compare variants on the same queries with similar budgets. Alongside mean F1, I would examine precision, recall, false matches for empty queries, relationships between samples, runtime and memory. Queries may reuse images; uncertainty estimates need to respect patient groups.
Validation helps us choose, so it is no longer independent of that choice. I would reserve an internal final assessment or use a group-based protocol separating tuning and evaluation. I would not choose a threshold after seeing final-test answers. Keeping a failed trial is useful too: it avoids spending another night on the same idea.
The answer file in this challenge links each query to its matches. Producing it requires a chain: read images, prepare regions, compute representations, combine signals and apply the final decision. That complete process is the pipeline.
I would preserve code, versions, preparation, weights, the patient split and threshold to reproduce the table. This does not mean the organiser requests all these components with a submission. Other competitions may require code or an executable model; check each case.
Before submitting, I would check that each identifier belongs to its gallery, no queries are missing and empty answers are interpreted correctly. The official description alternates between NONE and a blank field; I would check the current template and clarify that ambiguity before competing.
Prizes can be one reason, but the balance also includes staff time, machines and opportunities. A business may fund learning how to prepare images, adapt a model or maintain a reproducible service. Open comparison can assess capabilities and identify future colleagues. That return needs a goal and a budget; participation alone does not guarantee it.
In the comic, Nexo seeks applied research and talent development. This is a fictional decision, not a promise from Kaggle. Funding two teams does not turn an open competition into a duel between them. A strong result does not automatically make the data or weights usable in another business.
To control cost, I would first measure a small batch: disk reading, tile extraction, vector computation and comparison. Saving vectors helps test thresholds or combiners without rerunning the network; changing the network or preparation may invalidate that cache. At ATLAS, agent queries go through an API and text sent and received is measured in tokens. That allowance belongs to the language service, whose computation is supplied by the provider. Time and memory on the shared GPU and the availability of a reviewer remain separate accounts.
Data preparation, model adaptation, error analysis and delivery.
Permissions, the new population, quality and cost for the intended use.
Final ranking, income and whether the method works outside the challenge.
Sources reviewed on 27 October 2026. The published timetable announces a 31 October deadline and results in November. We do not present a final ranking or a winning recipe.
The Kaggle page explains the task; the article and its repository document the earlier research; model repositories help design comparisons. These materials serve different purposes. The data, code and leaderboard tabs did not return usable content during this check; that does not establish that they are empty.
To work through the guide yourself, start with a small permitted dataset, establish a baseline and record which hypothesis changes in each experiment. A table of model, preparation, parameters, validation score, runtime and observed errors is more useful than a list of networks we have never compared.